library(tidyplots)
# Set a data frame
df <- tibble::tibble(
x = c(1:3),
y = 1
)
battery_width <- 0.7
battery_height_half <- 0.3
# Plot
df |>
tidyplot(
x = x,
y = y,
paper = "#000000",
ink = "#ffffff") |>
add_data_points(size = 4, color = "#ffffff") |>
add_annotation_rectangle(
xmin = df$x - battery_width,
xmax = df$x,
ymin = df$y - battery_height_half,
ymax = df$y + battery_height_half,
color = "#ffffff",
fill = c("#000000", "#000000", "#000000"),
alpha = 1,
linewidth = 1) |>
add_annotation_rectangle(
xmin = df$x - battery_width,
xmax = df$x - c(0, battery_width/2, battery_width/5*4),
ymin = df$y - battery_height_half,
ymax = df$y + battery_height_half,
color = NA,
fill = c("#004488", "#ddaa33", "#bb5566"),
alpha = 1,
linewidth = 1) |>
add_annotation_rectangle(
xmin = df$x - battery_width,
xmax = df$x,
ymin = df$y - battery_height_half,
ymax = df$y + battery_height_half,
color = "#ffffff",
fill = c("#000000", "#000000", "#000000"),
alpha = 0,
linewidth = 1) |>
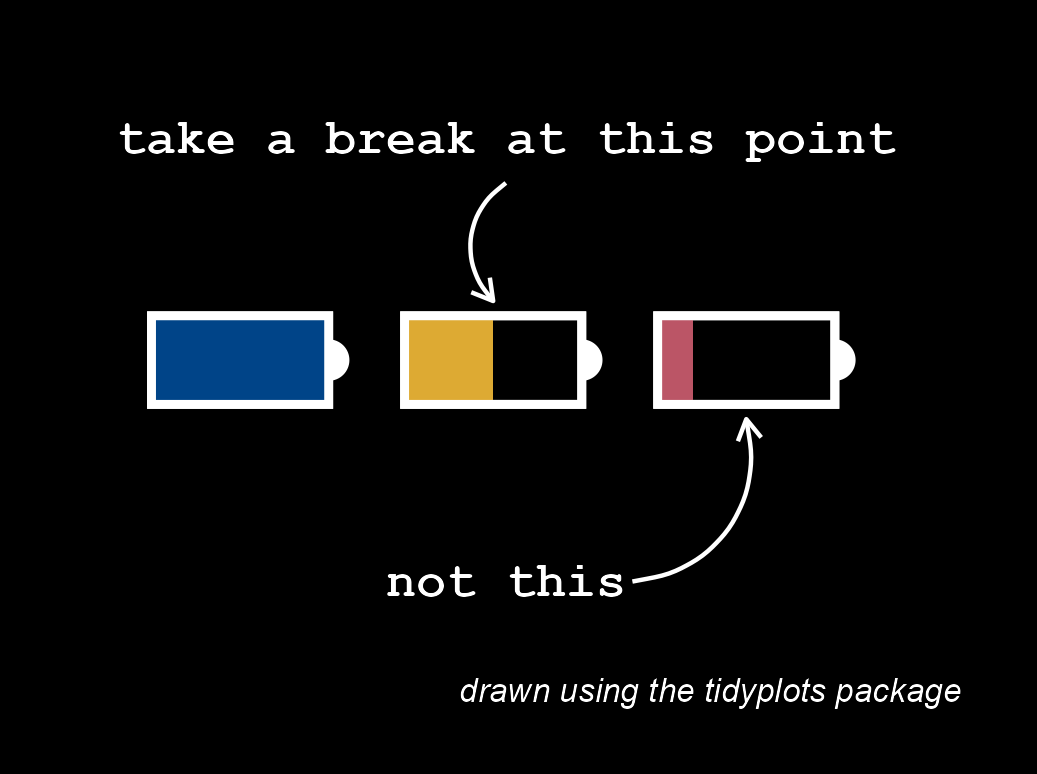
add_annotation_text(
text = c("take a break at this point", "not this"),
x = 1.7,
y = c(2.5, -0.5),
fontsize = 12,
fontface = "bold",
family = "mono"
) |>
add(ggplot2::annotate(
"curve",
x = c(1.7, 2.2),
xend = c(1.65, 2.65),
y = c(2.2, -0.5),
yend = c(1.4, 0.6),
linewidth = 0.5,
arrow = grid::arrow(length = grid::unit(2, "mm")))) |>
adjust_caption(
caption = "drawn using the tidyplots package",
fontsize = 8,
face = "italic") |>
adjust_y_axis(limits = c(-1, 3)) |>
adjust_x_axis(limits = c(0, 3.5)) |>
adjust_size(width = 75) |>
remove_x_axis() |>
remove_y_axis() |>
save_plot(
"images/2026-05-21_take-a-break.png",
view_plot = FALSE)10 Take a break
Take a break at this moment