tidyplots |> library() # for plotting
ggplot2 |> library() # for plotting
magick |> library() # for reading image
grid |> library() # for changing image to graphic object
# Collect relevant data from https://github.com/qupath
qupath_history <- data.frame(
Version = c(
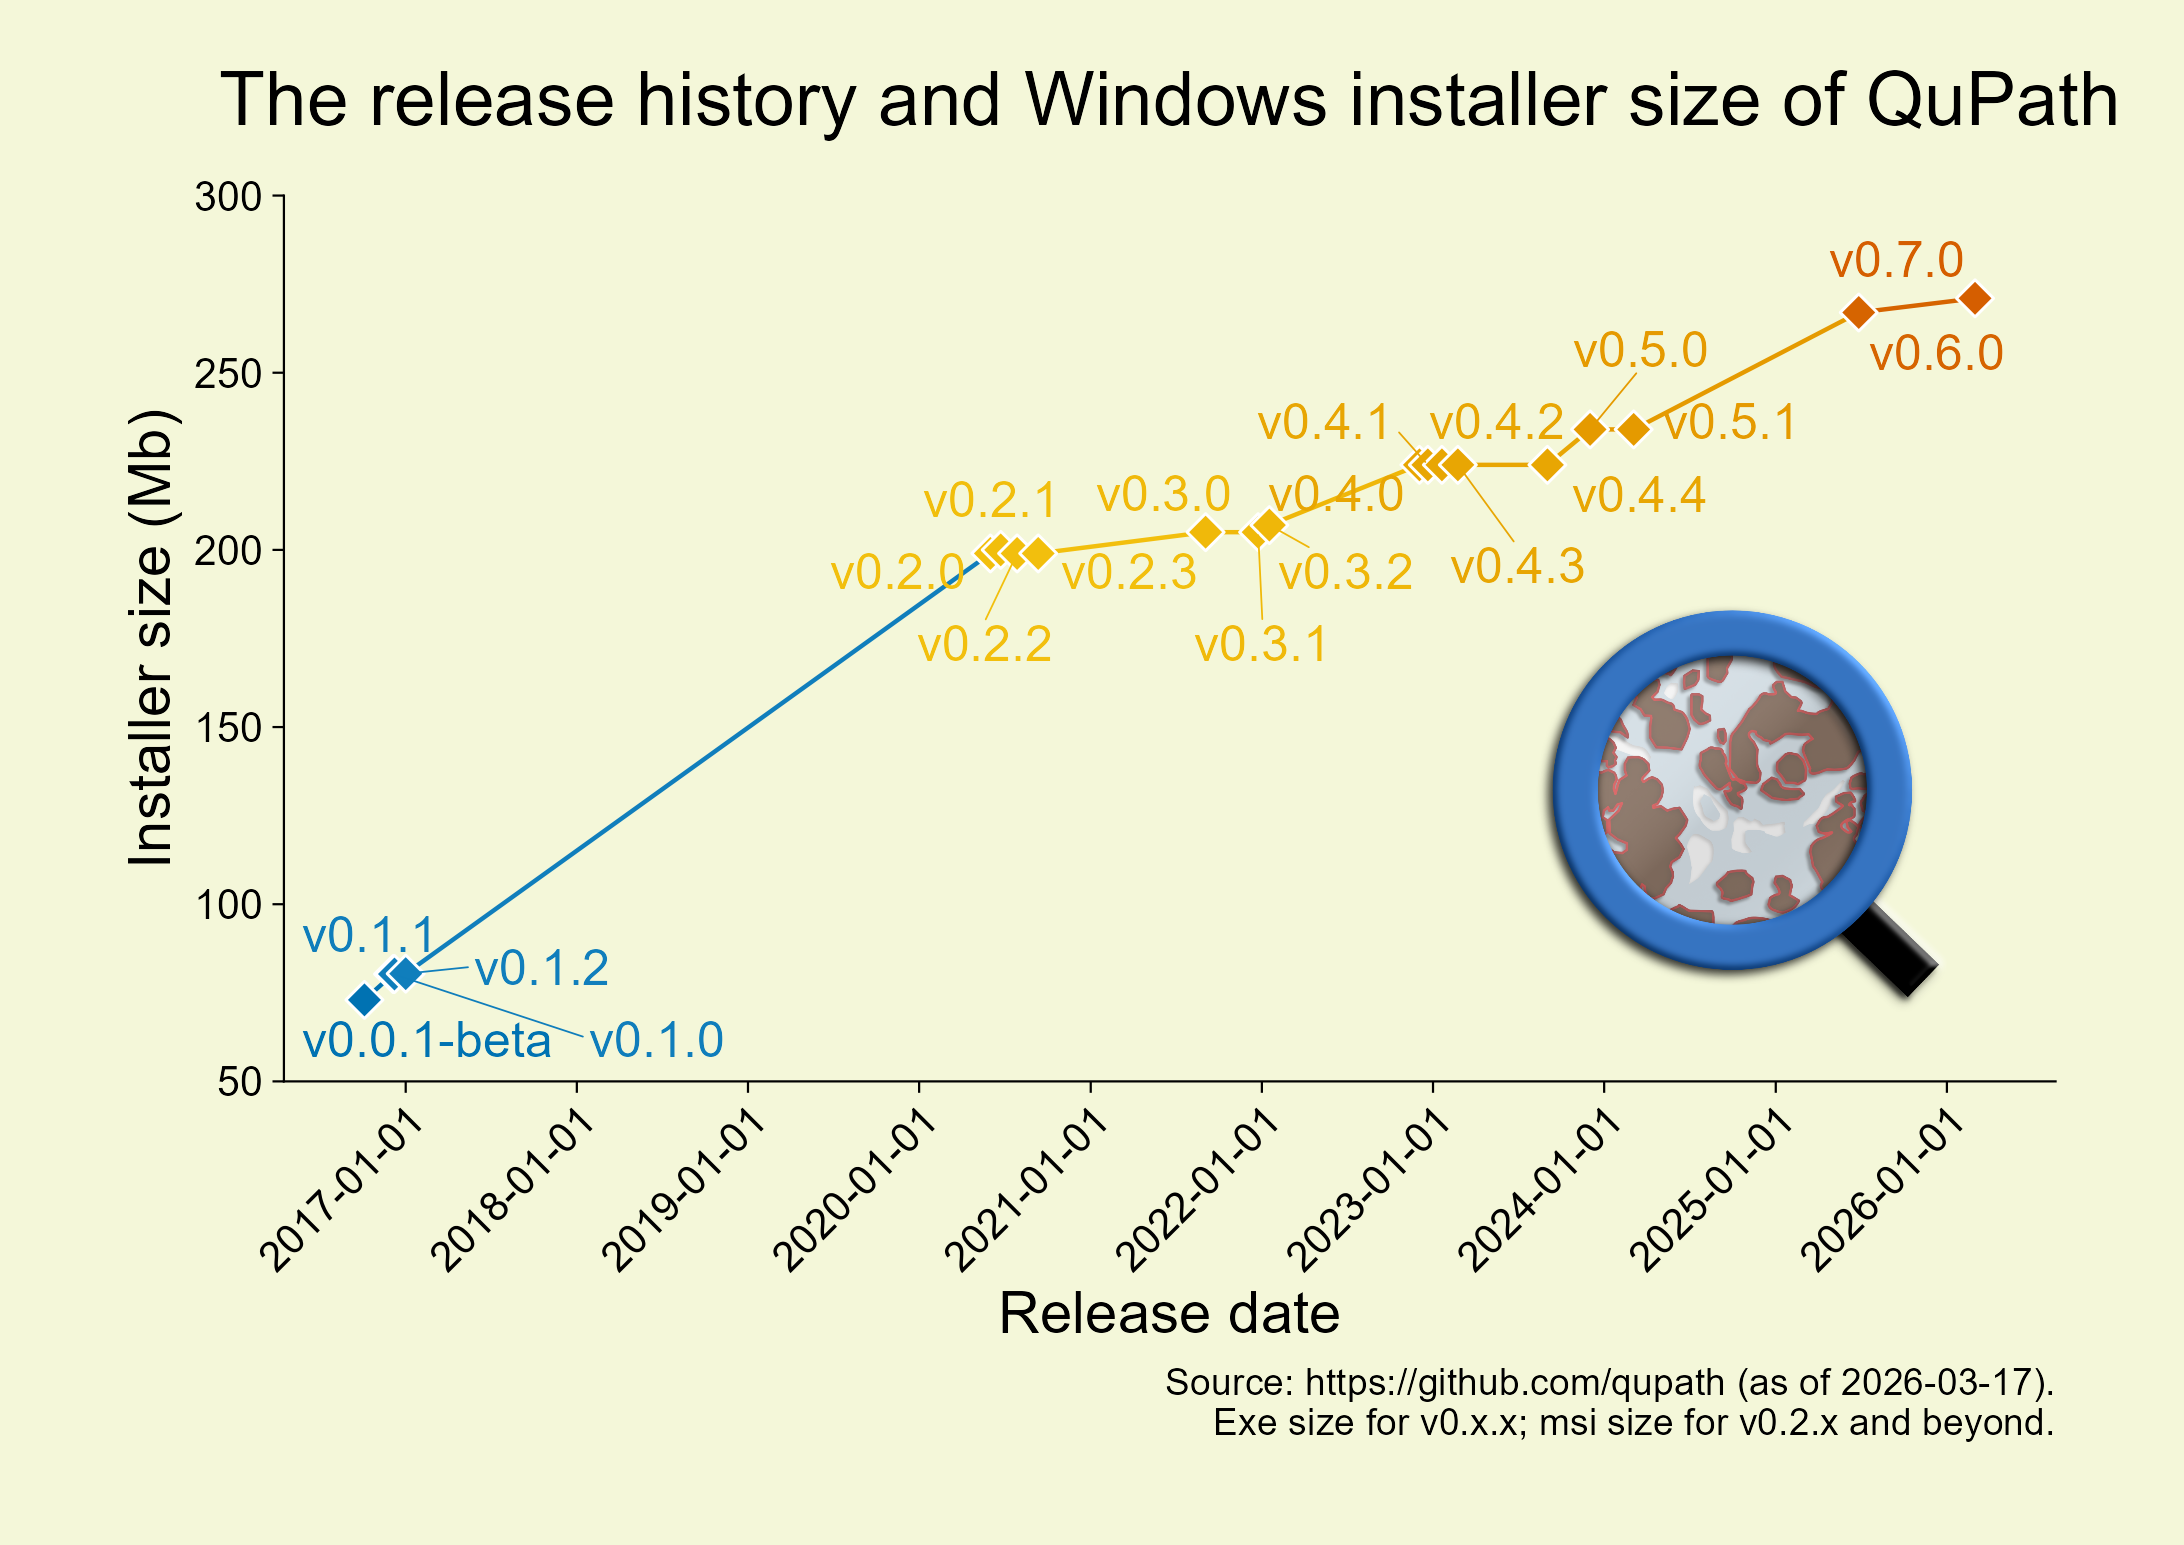
"v0.0.1-beta", "v0.1.0", "v0.1.1", "v0.1.2", "v0.2.0", "v0.2.1", "v0.2.2", "v0.2.3", "v0.3.0", "v0.3.1", "v0.3.2", "v0.4.0", "v0.4.1", "v0.4.2", "v0.4.3", "v0.4.4", "v0.5.0", "v0.5.1", "v0.6.0", "v0.7.0"
),
Release_date = as.Date(
c(
"2016-10-05", "2016-12-05", "2016-12-08", "2017-01-01", "2020-06-01", "2020-06-23", "2020-07-28", "2020-09-11", "2021-09-03", "2021-12-24", "2022-01-17", "2022-12-03", "2022-12-21", "2023-01-20", "2023-02-23", "2023-09-02", "2023-12-02", "2024-03-04", "2025-06-27", "2026-03-02"
)
),
Installer_size = c(
73, 80.3, 80.3, 80.4, 199, 200, 199, 199, 205, 205, 207, 224, 224, 224, 224, 224, 234, 234, 267, 271
)
)
# Read the image of qupath
qupath <- "images/qupath.png" |>
magick::image_read()
qupath_grob <- qupath |>
grid::rasterGrob() # Change to graphic object
qupath_history |> tidyplot(x = Release_date, y = Installer_size, color = Installer_size) |>
add(ggplot2::geom_line(size = 0.6)) |>
add_data_points(size = 2, white_border = TRUE, shape = 18) |>
add_data_labels_repel(label = Version, fontsize = 12, min.segment.length = 0) |>
add_title("The release history and Windows installer size of QuPath") |>
add_caption(paste("Source: https://github.com/qupath (as of 2026-03-17).", "Exe size for v0.x.x; msi size for v0.2.x and beyond.", sep = "\n")) |>
adjust_size(width = 150, height = 75, unit = "mm") |>
adjust_font(fontsize = 10) |>
adjust_y_axis(limits = c(50, 300), breaks = seq(50, 300, 50)) |>
adjust_x_axis(breaks = "1 year", ) |>
add(ggplot2::theme(axis.text.x = element_text(angle = 45, vjust = 1, hjust = 1))) |>
add(ggplot2::annotation_custom(qupath_grob, xmin = as.Date("2023-07-01"), xmax = as.Date("2026-01-01"), ymin = 60, ymax = 200)) |>
adjust_x_axis_title(title = "Release date", fontsize = 14) |>
adjust_y_axis_title(title = "Installer size (Mb)", fontsize = 14) |>
adjust_colors(new_colors = colors_discrete_friendly) |>
adjust_title(fontsize = 18, vjust = 3) |>
adjust_caption(fontsize = 9) |>
adjust_theme_details(plot.background = ggplot2::element_rect(fill = "#f4f7d9"), panel.background = ggplot2::element_rect(fill = "#f4f7d9")) |>
adjust_legend_position(position = "none") |>
save_plot("images/2026-03-14_qupath-release-history-and-size.png", view_plot = FALSE) 13 QuPath-History-Size
QuPath release history and installer (.msi in Windows) size
除过v0.0.1-beta(属于Pre-release),其它的pre-release版本不统计。
Note
v0.x.x统计的是.exe格式文件的大小;v0.2.x及之后版本统计的是.msi格式文件的大小。