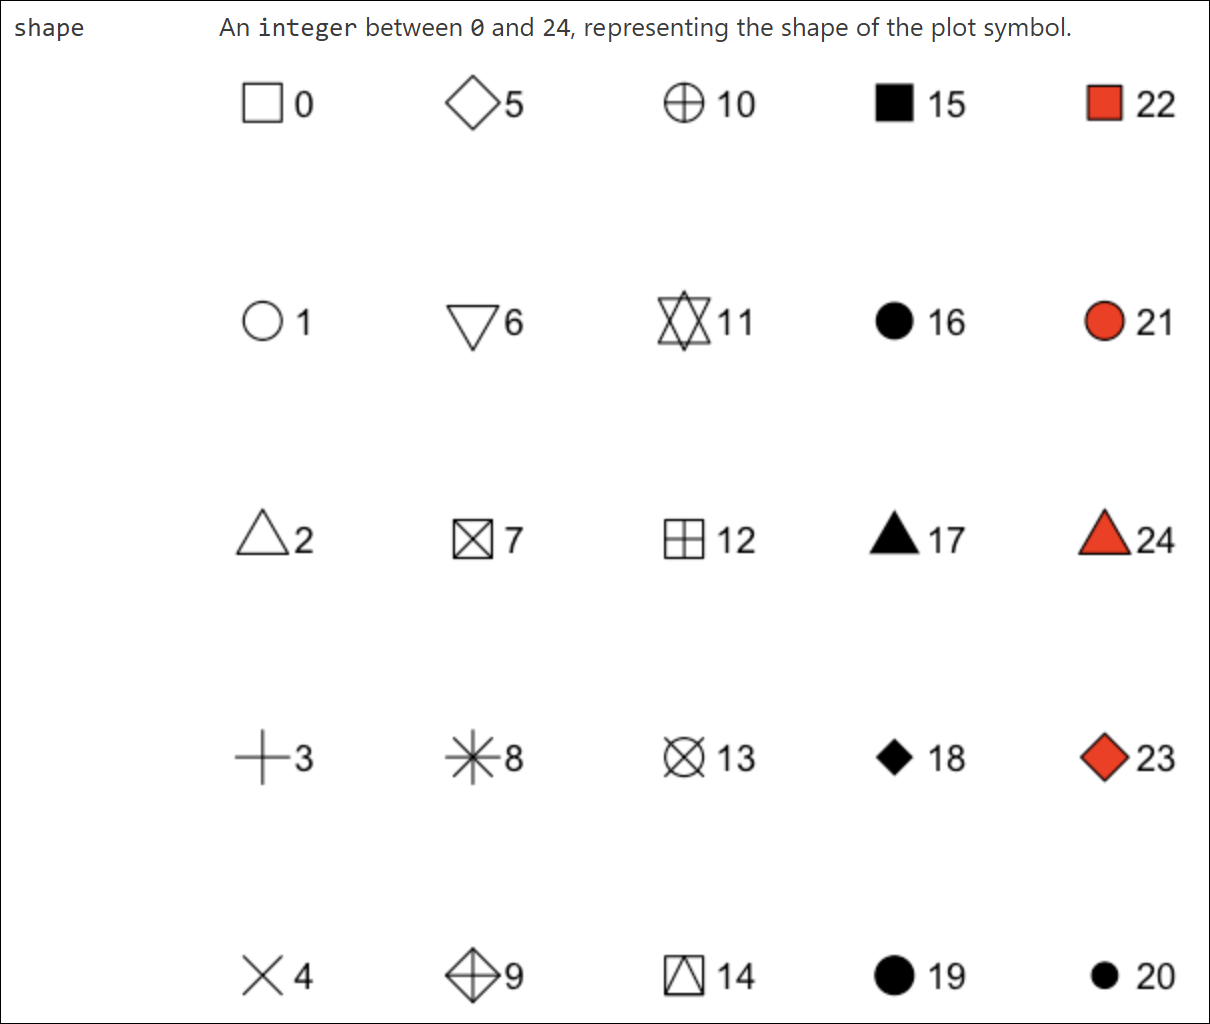
An integer between 0 and 24, representing the shape of the plot symbol.
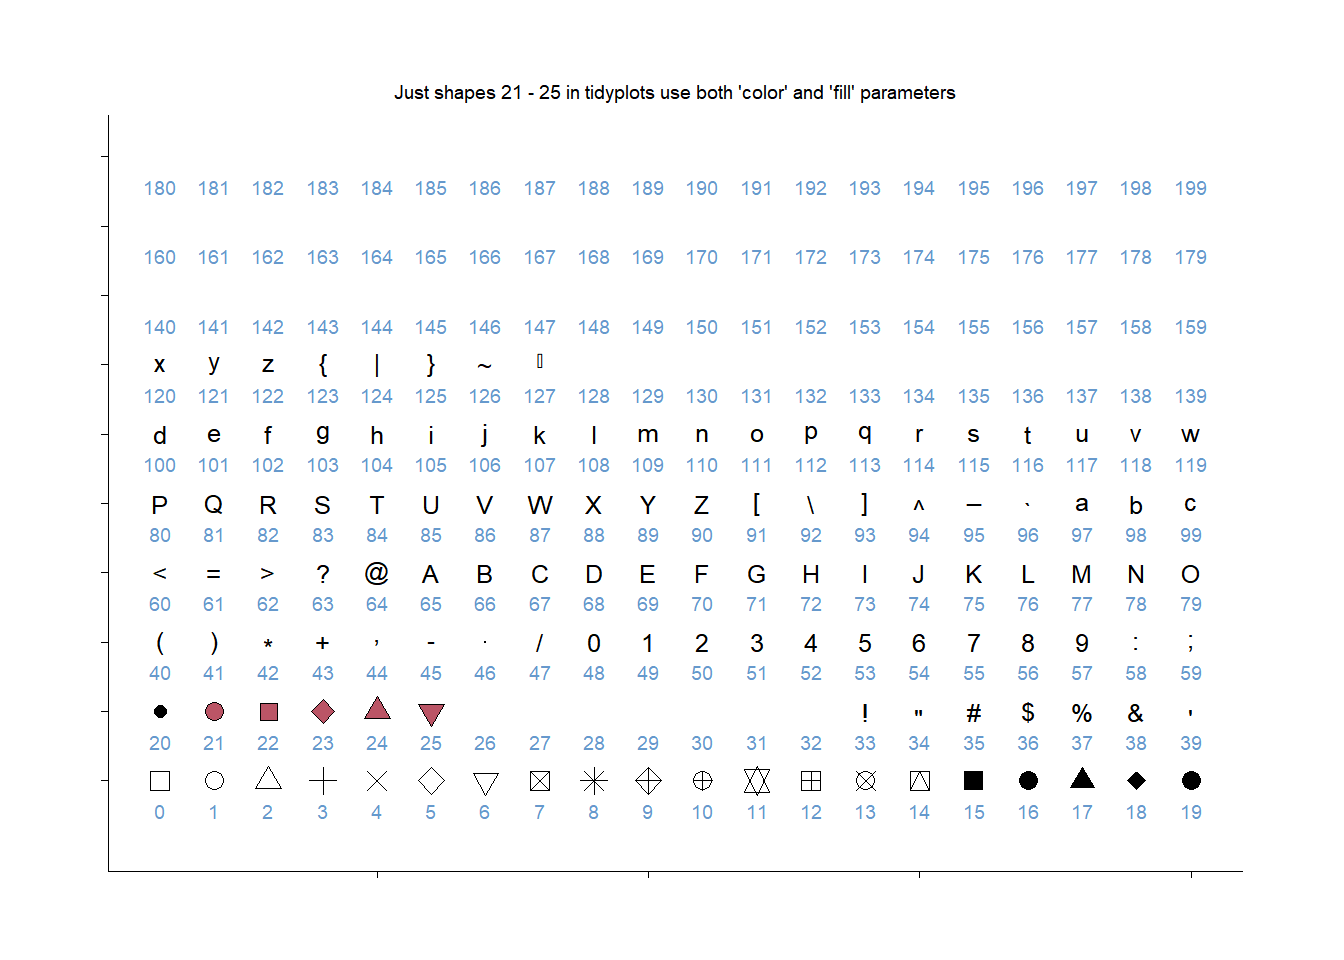
tidyplots |>library()# Set a df for point plottingdf <- tibble::tibble(x =rep(1:20, length.out =200),y =rep(letters[1:10], each =20),shape =seq(0, 199) # testing more numbers here)df |>tidyplot(x = x, y = y) |>add_data_points(shape = df$shape, size =3, color ="#000000", fill ="#bb5566") |>add_annotation_text(text = df$shape, x = df$x, y = df$y, vjust =2.5, color ="#6699cc") |>adjust_size(width =150, height =100) |>adjust_y_axis(limits =c(0.3, NA)) |>remove_x_axis_labels() |>remove_y_axis_labels() |>remove_x_axis_title() |>remove_y_axis_title() |>add_title("Just shapes 21 - 25 in tidyplots use both 'color' and 'fill' parameters")